A training job can look busy without making useful progress. GPU utilization tells us that something ran; a rising memory curve tells us that something accumulated. Neither measurement alone identifies the responsible code or establishes whether it delays the next training step.
Omni Profiler is a continuous profiler that connects CPU/GPU memory and compute to Python and native code. It is used by Seed RL to investigate training workloads. The central design question is how to turn resource observations into an attribution that an engineer can act on.
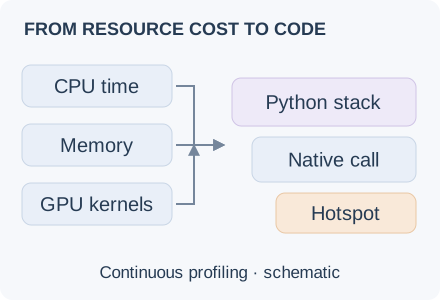
Conceptual resource attribution. The boxes do not encode measured time, bytes or overhead.
A peak is a symptom; attribution makes it actionable
Consider a hypothetical job whose host memory grows across iterations. A process-level curve cannot distinguish live allocations retained by application code from memory reserved by an allocator. The two observations can require very different responses.
There are several questions to answer before changing code: what resource is being measured, which process owns it, which stack created it, and whether the allocation has been released. On the compute side, a kernel’s duration and the host code that launched it provide another view. Together, these views help turn “memory is high” or “the GPU is busy” into an investigation that a developer can follow.
Omni combines eBPF tracing, userspace allocation tracking and GPU instrumentation to connect these observations to code. Continuous collection and process discovery support looking at behavior over time, rather than relying entirely on a manually captured interval.
The units must survive the visualization
A profiler can show several resources in the same interface without making them interchangeable. CPU time, GPU kernel duration, live allocated bytes and allocation traffic answer different questions.
For example, live memory depends on allocation and release lifetimes. Adding every allocation observed over a run measures traffic, not the amount retained at its end. Similarly, a long GPU kernel is not automatically the reason the request or training step took longer. It may overlap other work.
Interpreting a profile requires identifying the weight assigned to each sample and the interval it covers. A wide stack indicates a large contribution to that specific measure. Using the wrong denominator can lead to optimizing a resource that does not constrain the workload.
Continuous collection changes the trade-off
A detailed trace of every event is attractive until collection changes the workload being measured. Sampling reduces that cost, but introduces another question: which events and stacks are represented well enough to support the conclusion?
The goal is evidence that remains useful across a long-running workload. Collection overhead, missed observations and stack attribution all affect that evidence. A missing stack should not be interpreted as zero resource use, and an unobserved event should not silently become a confirmed absence.
The profiler also requires validation. Attribution can be checked against an independent resource measurement and a controlled workload whose behavior is understood. Agreement on a synthetic case validates that case; it does not establish accuracy for every real job.
A hotspot is a hypothesis about the bottleneck
Suppose a hypothetical profile attributes substantial time to a CPU function. Making that function faster will shorten the training iteration only if its work constrains progress. If it finishes while a longer GPU operation is still running, the local speedup may have little effect on elapsed time.
The practical loop is: identify a suspicious resource cost, inspect its code and lifecycle, locate it in the execution timeline, then measure the workload after a targeted change. The final comparison is step time, throughput or memory headroom under the same workload—not simply a smaller rectangle in the profile.
That distinction is particularly useful in RL infrastructure, where several kinds of work interact and a local measurement may not represent the entire iteration.
Profiling in controlled training experiments
Capability experiments measure how models respond to controlled training interventions. Profiling asks whether the infrastructure is running those interventions as intended and where their cost comes from. Both require a measurement whose meaning survives inspection.
Omni’s role in that loop is resource attribution: connect observed cost to the responsible execution context, then use that evidence to guide and validate an engineering change. Agent execution analysis applies a related measurement discipline at the task and tool-call level; it does not replace CPU/GPU profiling.
The examples in this article are explanatory scenarios, not production incident reports.
Comments